Are you overwhelmed by the amount of data that Google Analytics gives you? You likely signed up for it to see how many people read your webcomic and now you’re sorting through page views, bounce rates and tons of other numbers that you’re not sure what to do with. It all seems interesting, but how can these numbers be used for something other than entertainment and ego boosting? One of the most powerful things you can do with Google Analytics is use the statistics it provides to find out if the way you’re marketing your webcomic is achieving the results you want.

Image by Patrick Yurick of Yurickcomics.tumblr.com
You spent time and money on marketing tactics like advertising and networking, and it’s all a waste if you don’t evaluate whether it helped you achieve your goals. If you spend $100 on ads hoping they will generate traffic to your website, you need to find out how many visitors are referred to your website by those ads. Google Analytics can provide you with the information you need to find out what’s working and what’s not, so you can start spending your time and money in the right places. The following examples will demonstrate how you can use Google Analytics to improve your webcomic marketing.
A basic understanding of Google Analytics will help you get the most out of these examples. This article is a great place for beginners to learn more about the program http://www.socialmediaexaminer.com/google-analytics-basics/.
How to tell if attending a Comic Convention increased traffic to your webcomic
The audience report in Google Analytics provides you with information about the people who visit your website. You can find out almost anything from the city your visitors live in to the type of device they are viewing your website with. It also provides you with statistics that can help you determine if attending a Comic Convention increased traffic to your website. For example, an increase in the number of new visitors to your website the week after the event might indicate that it was a great use of your time. On the other hand, statistics like the bounce rate might provide a different conclusion. The bounce rate is the number of visitors who left your website without looking at other pages. Consequently, a high bounce rate for the week following the convention might suggest that while a lot of potential fans looked at your webcomic, it did not necessarily interest them. This might suggest that the people who attend that event are not the right target market for your comic.
Even if the bounce rate is low, you should keep an eye on the number of returning visitors your website has. If the event was truly a success, you should see an increase in the number of returning visitors in the weeks and months after the convention. In the chart below you can see that there was a spike in returning visitors in March and the plot line remained at that higher level rather than returning to the previous numbers.
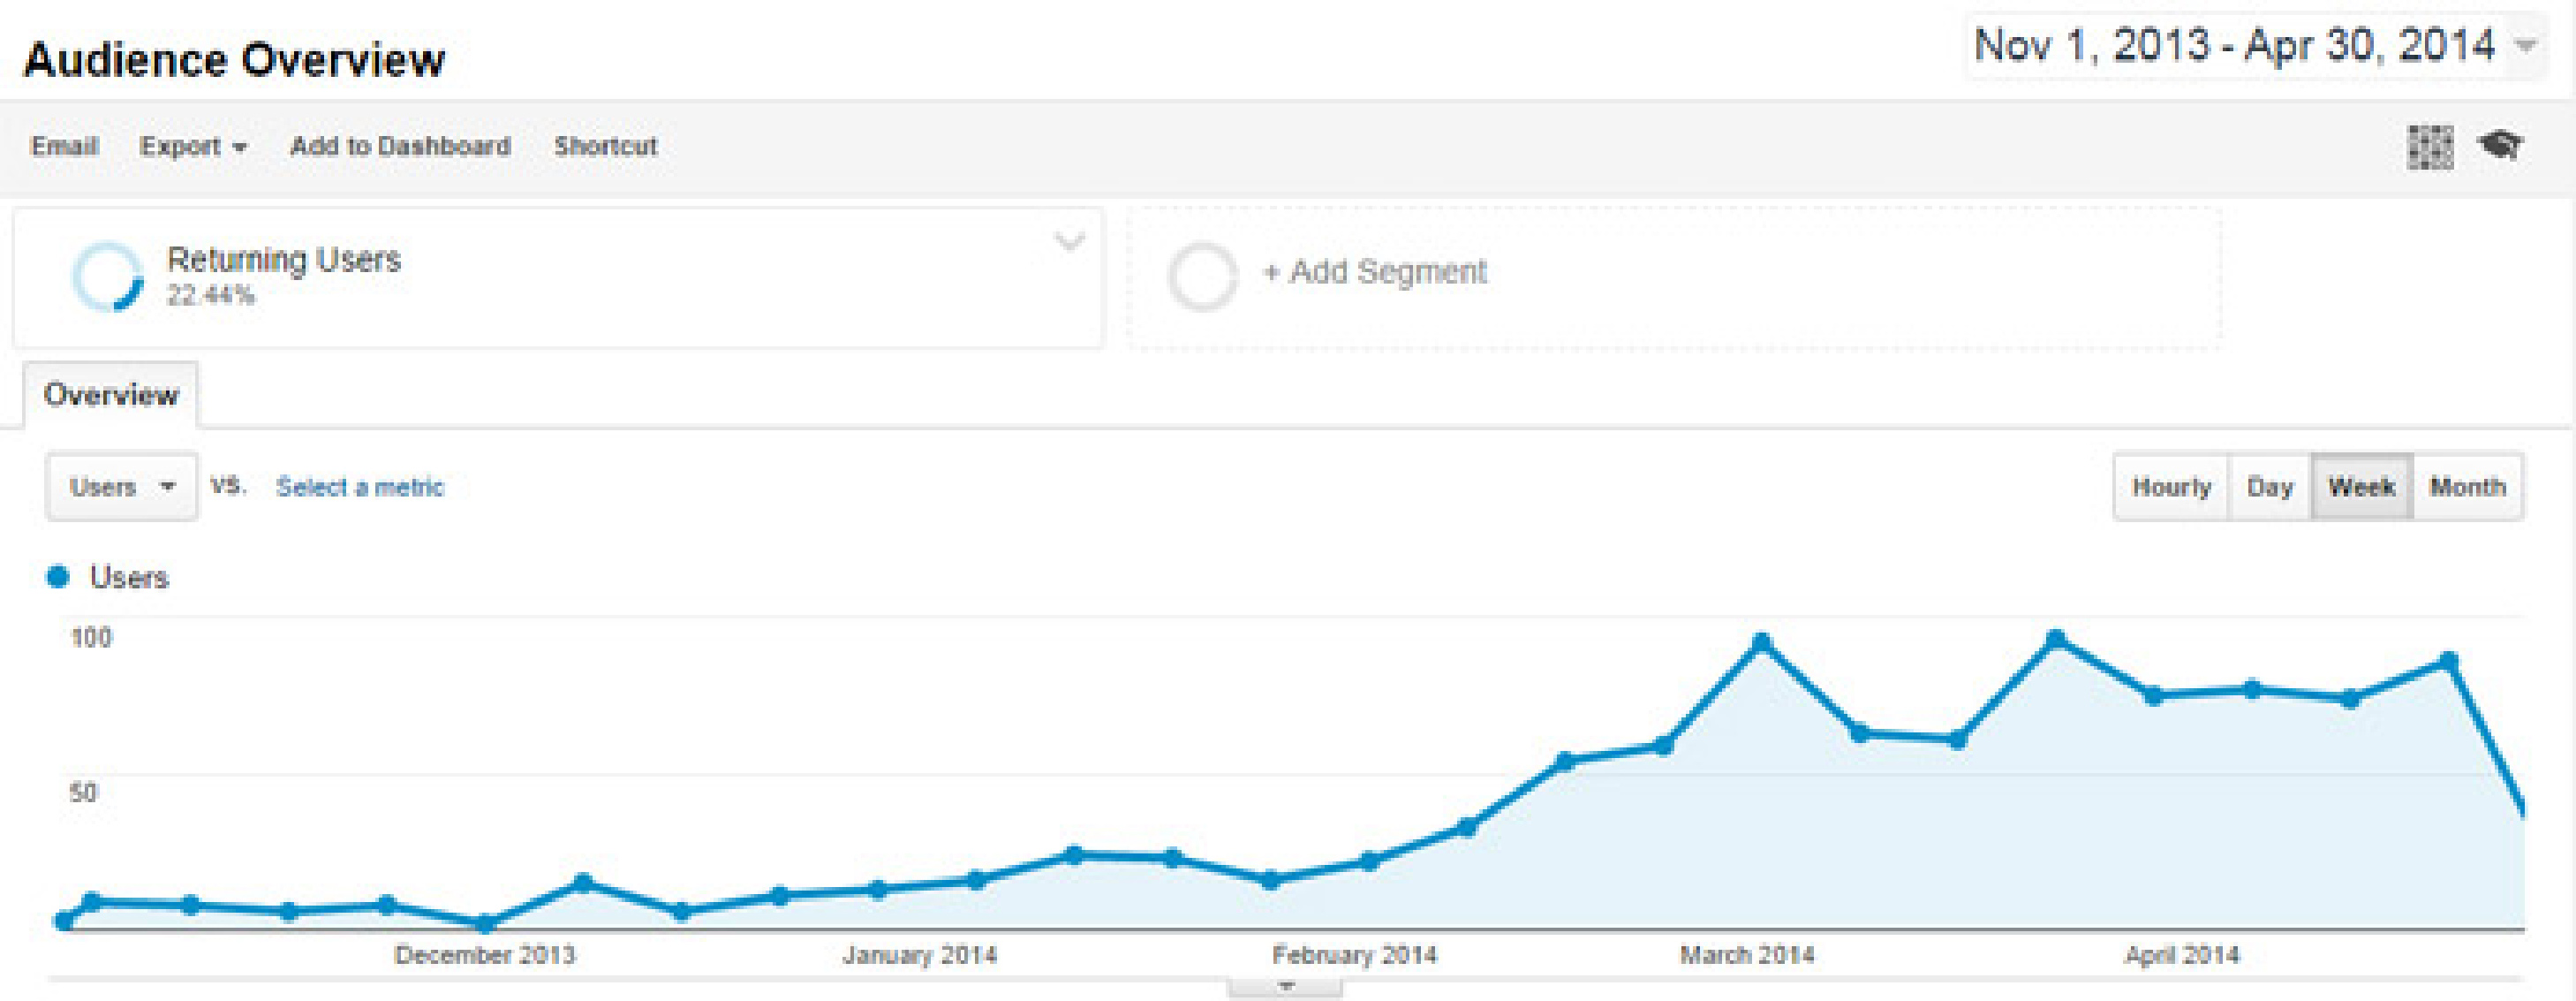
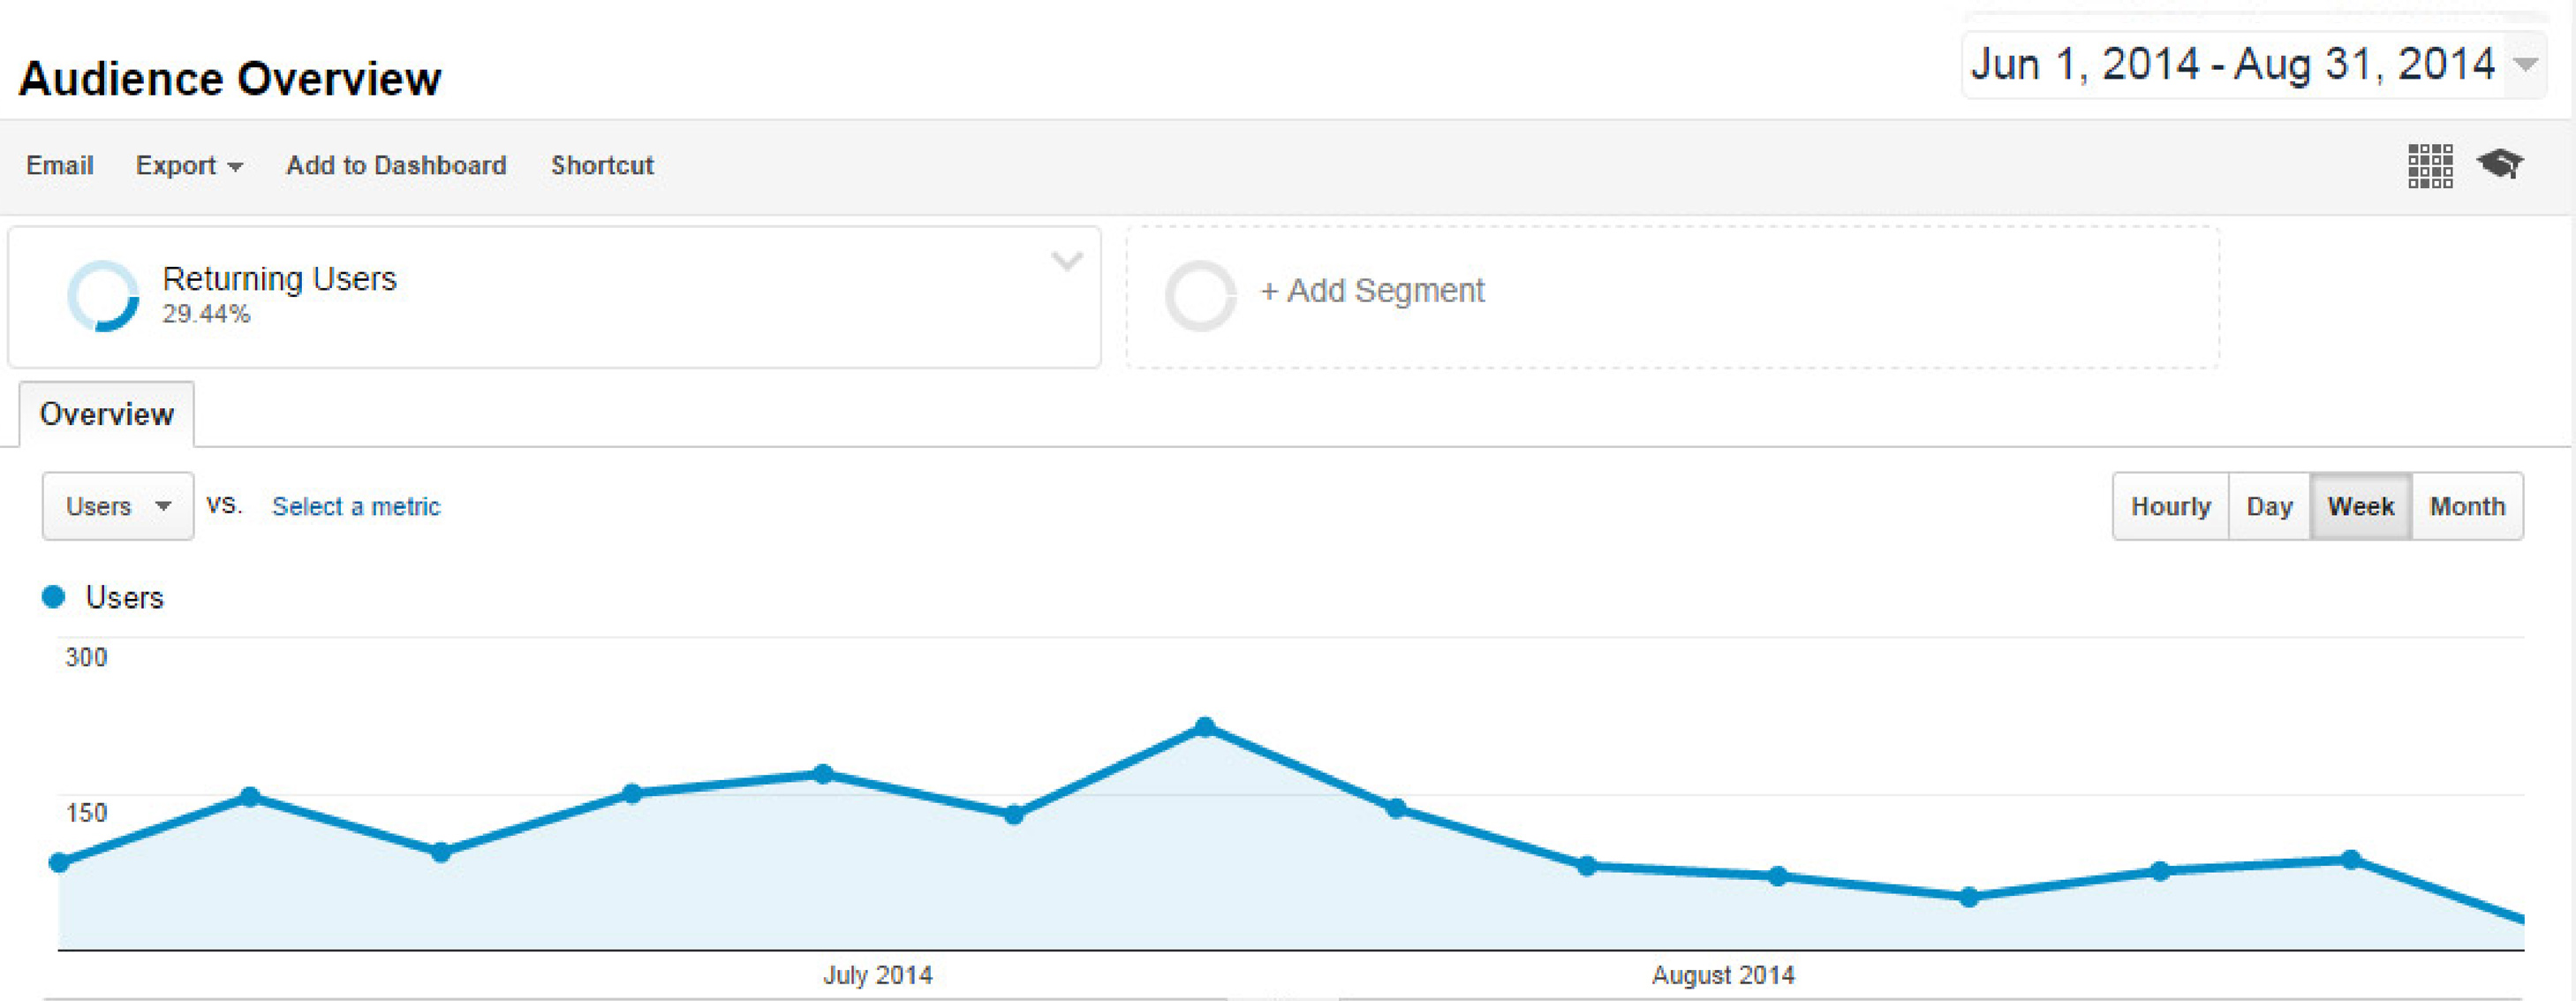
This shows that the website gained new visitors who ultimately became returning visitors. Compare this with the chart below where you can see how the plot line dips back down indicating that the new users may not have become loyal fans.
As you can see, Google Analytics has multiple statistics that can give you a good idea of the number and type of visitors that come to your webcomic after an event. Once you become familiar with the program and start asking yourself the right questions, you’ll be able to find the statistics that will help you get a higher return from your marketing activities.
Statistics that will help you figure out if posting your comic on social media is a waste of your time
Have you ever wondered what would happen if you stopped posting your webcomic on social media websites? Posting your comic on a site like Twitter may be one of the things you’re doing to make sure your fans keep reading your comic, but it can be a huge drain on your time. Google Analytics provides you with statistics about where your traffic is coming from in the acquisition report, and it can help you figure out if all your work is paying off. You can view statistics for all of the social media platforms together or drill down and view the numbers for a specific platform like Facebook. Viewing this report will tell you how many people Facebook sent to your website along with other useful information like how many pages they looked at and how much time they spent on your website. If the statistics show that Facebook is not sending anyone to your website, you may want to think about whether you are using it effectively or if the Facebook crowd is the wrong target for your comic. You can also use the acquisition report to find out how much traffic is being sent to you by search engines, advertisements, directories, and more.
Sell more merchandise by looking at how people behave on your website
A lot of webcomic creators try to make money by selling merchandise like books, t-shirts, mugs and posters on their website. You may have created pages on your website to promote these products, but you can’t figure out why people are not buying anything. The behavior reports in Google Analytics provide you with information about how people use your website and a good look through here can help you figure out why visitors are not doing what you want them to. For instance, the site content report contains information like the bounce rate, page views and time spent on page for each page on your website. You may find that lots of people are visiting your t-shirt page, but no one is visiting your posters page. This could indicate many things. Your fans might not be interested in posters or you may have done a better job promoting t-shirts on your website and now need to do the same for posters. You may need to work on making the links to your poster section more visible or enticing.
The fact that people are visiting your t-shirts page and not buying anything also gives you a lot of information. First, your fans are interested enough in buying t-shirts to visit the page, but something there prevented them from going through with a purchase. It might be time to look at things like the quality of the t-shirt designs, pricing and visibility of the button to purchase products.
This basic information can give you the insights you need to improve the usability of your website and the quality of your products, but there are even more powerful features available for people who want more. Advanced features will let you see exactly how users are moving from page to page, allow you to test different content, and find out how many users completed specific actions like watching a video.
As you can see, Google Analytics contains valuable information that can help you evaluate the effectiveness of your marketing activities. Familiarizing yourself with the program and learning more about what types of statistics are available will help you identify the information that will provide the most insight into the results being produced by your time and money. Using this information to find the best ways to market your comic will help you get the success you’re looking for.
By Shannon Maguire, Co-Creator of Matt Against the World http://mattagainsttheworld.com/
makingcomics.com
The most useful thing for me was using Analytics to figure out what traffic sources gave me not just lots of hits, but lots of ENGAGEMENT – people who spent a while on the site reading multiple pages of comics. I could then do some targeted ad buys there to get more people aware of and watching my comic.
It’s always a good idea to remind us how important it is to measure the ROI (Return On Investment) of marketing campaign… Since most of us focus on ART and forget about ROI.
However, for social media it’s a little more complex (third paragraph) :
1) You can now use services like http://bufferapp.com to save some time (and please all your readers).
2) To ttract more and more people via social media, you’ll need to apply all sort of crazy rules (and at the end, you won’t be able to get anything from Google Analytics, since it doesn’t really explain the stats). Some of the insights you can read at http://blog.bufferapp.com should be compiled in an article about social media strategy.